Skip to content
English
  • There are no suggestions because the search field is empty.

Managing creators

You can add creators to CreatorDB database or view a creator’s profile and content performance. Additionally, CreatorDB allows you to manage multiple creators through the Groups feature.

Adding a creator to the database during a search

When you cannot find a creator through the search bar, you can submit this new creator to the CreatorDB database.

  1. Log in to CreatorDB.
  2. Enter a creator's ID or name in the search bar.
  3. Click on a social media platform.
    submit_by_search_1
    The creator is submitted to the CreatorDB database.
    submit_by_search_2

Adding creators to the database by entering account details

  1. Log in to CreatorDB.
  2. Click Add creators.
    The Add new creators to CreatorDB window appears.
    add_creators_labeled
  3. Select a social media platform.
  4. Enter the required details in the Submission area.
  5. Click Submit.
    add_creators_by_input_labeled

Adding creators to the database by uploading file

Important: To upload multiple creators from a file, save the file in .csv format and follow the template format.

  1. Log in to CreatorDB.
  2. Click Add creators.
    The Add new creators to CreatorDB window appears.
    add_creators_labeled

  3. Click Upload.
    A window appears.
    add_creators_by_file_1_labeled
  4. Select a file.
  5. Click Open.
    add_creators_by_file_2_labeled
  6. Click Submit.
    add_creators_by_file_3_labeled

Viewing creator submission history

The Submission history shows the creator records you submitted to the CreatorDB database. It shows whether the creator was successfully submitted. Adding the creator's data to the database can take one workday.

submission_history_labeled

No. Label Description
1 Updated Shows the last date the system updated the submission history.
2 Update status Refreshes the submission history to show the latest submitted creator record status.
3 Channel name Shows the creator's channel name, location, and whether the creator account is verified.
4 Channel ID Shows the YouTube channel ID.
5 Submitted time Shows when you submitted the creator.
6 State Shows the creator submission status. Submitted creators will undergo a review process before they are added to the database. Please see the following table for all submission states and descriptions.
Submission states Description
Success The creator has been submitted to the CreatorDB database and will undergo the review process.
Already exists The submitted creator's data is already available in the CreatorDB database
Not available The submitted creator's format is invalid. Please check the submitted creator's ID follows the format in the on-screen instructions or if the submitted file format is the same as the template file.
Process worker error An error occurred while processing the submitted creators' data. If you encounter this error, please contact CreatorDB at support@creatordb.app.
User not found The system did not find the submitted creator's data.
Private user The submitted creator account is private.

Viewing a creator’s profile and performance

To help you find the best creator for online collaborations and campaigns, CreatorDB offers key insights into a creator's content performance, growth rates, and more. CreatorDB collects publicly available data regularly and directly from the source platforms, then uses AI, ranking algorithms, and other statistical methods to provide insights and add more critical context about the creator and their content. Several key indicators include the CreatorDB score, which provides an overview of key performance indicators, such as engagement rate, follower growth, upload time, and more.

Key indicators and definitions

creator_profile_labeled

No. Label Definition
1 Profile picture The creator's profile picture.
2 Creator name The creator's name or username.
3 Verification badge Badge that indicates the creator has been verified by social media platforms, such as YouTube, Instagram, or TikTok.
4 Topics The main topics of the creator’s content.
5 Add to group Add this creator to an existing group or a new group.
6 Location The creator's location.
7 Language The creator's spoken language.
8 YouTube subscribers The creator's total number of YouTube subscribers.
9 Instagram followers The creator’s total number of Instagram followers.
10 TikTok followers The creator’s total number of TikTok followers.
11 Total followers The total number of followers is calculated by adding the creator's followers on YouTube, Instagram, and TikTok.
12 Followers growth The monthly follower growth rate of the creator's main platform. A negative value indicates a decline.
13 CreatorDB score An indicator that shows the creator’s overall performance on social media platforms based on the following six indicators: subscriptions, average views, engagement rate, subscription growth, average views growth, and engagement growth rate. The raw score is calculated by adding the six indicators and then finding the average compared to all other creators on social media platforms. The score range is on a scale from 0 to 100.
14 Engagement rate The engagement rate of the creator's main platform is displayed. The engagement rate is an indicator that shows how viewers interact with the content.
15 Recent sponsors The latest brands to sponsor the creator's content.
16 View emails The creator’s email contact.
17 Channel ID The creator’s YouTube channel or account ID.
18 Mentioned links Links on the creator's profile.
19 Discord account The creator's Discord page.
20 Last updated The most recent time the system updated the creator's profile.
21 Personal description The creator’s channel or account description.

Overview

The All platforms page on Overview lets you view the creator's overall performance on major social media platforms, including YouTube, Instagram, and TikTok. It also allows you to view key performance indicators at a glance.

Platform statistics

On the All platforms page, you can view a summary of the creator's social media performance on multiple platforms. Note that this page only displays information from platforms where the creator has an account. In this example, we will look at a creator whose primary account is on YouTube. Aside from a few exceptions, all data is automatically collected from the relevant platform.

all_platform_overview_platform_statistics_labeled

No. Metric Definition 
1 Main platform A label that shows the creator's primary social media platform.
2 Total subscribers The total number of YouTube subscribers this creator's channel has.
3 Active A label that shows which social media platforms this creator has been actively posting content on over the last 30 days.
4 YouTube subscriber growth rate This creator's YouTube channel's subscriber growth rate over the last 30 days.
5 Active subscribers The percentage of actively engaged subscribers on this creator's YouTube channel. This is calculated as follows: Average Video Views/Subscribers
6 Average views The average number of views YouTube videos received over the past month.
7 Engagement rate (YouTube) YouTube engagement rate is calculated as follows: (Likes+Comments)/Views
8 Average likes/ Comments The average number of likes and comments the creator's videos received on YouTube.
9 Latest content (YouTube) The latest date the creator uploaded content to YouTube.
10 Total Instagram followers The total number of Instagram followers this creator's account has.
11 Instagram follower growth rate This creator's Instagram account's follower growth rate over the last 30 days
12 Engagement rate (Instagram) Instagram engagement rate is calculated as follows: (Likes+Comments)/Followers
13 Average likes The average number of likes for each Instagram post.
14 Average comments (Instagram) The average number of comments for each Instagram post the creator posted.
15 Total posts The total number of Instagram posts the creator has posted.
16 Latest content (Instagram) The latest date that the creator posted content onto Instagram.
17 Total TikTok followers The total number of followers the creator's TikTok account has.
18 TikTok follower growth rate The creator's TikTok account's followers growth rate over the last 30 days.
19 Average plays The average number of plays the creator's videos received on TikTok.
20 Average hearts The average number of hearts received by the creator’s TikTok videos.
21 Average comments (TikTok) The average number of comments received by the creator's TikTok videos.
22 Engagement rate (TikTok) Used to measure followers' interaction with content created by creators or influencers. TikTok engagement rate is calculated as follows: (Hearts+Comments+Shares)/Plays
23 Latest content (TikTok) The latest date the creator posted content onto TikTok.

Creator overview

creator_overview_labeled

No. Metric Definition
1 CreatorDB score A unique score is calculated by adding subscriptions, average views, engagement rate, subscription growth, average views growth, and engagement growth rate and finding the median value. The score ranges from 0 to 100.
2 Follower rank by country The creator's followers' national rankings compared to other creators from the same country in the CreatorDB database.
3 Follower rank by language The creator's followers rank by language compared to other creators from the same language in the CreatorDB database.
4 Global follower rank The creator's global rankings for total followers compared to other creators in the CreatorDB database.
CreatorDB score metrics

creator_db_score_labeled

Stars Score range
0 stars 0
0.5 stars 1 to 10
1 star 11 to 20
1.5 stars 21 to 30
2 stars 31 to 40
2.5 stars 41 to 50
3 stars 51 to 60
3.5 stars 61 to 70
4 stars 71 to 80
4.5 stars 81 to 90
5 stars 91 to 100

creatordb_score_grade_labeled

Ranking description Score range
Poor 0 to 25
OK 26 to 50
Good 51 to 65
Great 66 to 80
Excellent 81 to 90
Superb 91 to 100

Follower metrics

The follower metrics are updated daily and show a line graph over 90 days. On the All platform page, the line graph shows changes in follower growth on YouTube, Instagram, and TikTok. The Total follower growth indicators over 7 days, 30 days, and 90 days data are from the main platform where the creator is most active.

total_follower_growth_labeled

No. Metric Definition
1 Last updated The last date the system updated this creator's total follower growth data.
2 Last 7 days growth The total follower growth rate over the last 7 days (about 1 week).
3 Last 30 days growth The total follower growth rate over the last 30 days (about 1 month).
4 Last 90 days growth The total follower growth rate over the last 90 days (about 3 months).
5 Follower growth The creator's total follower growth rate over one year. By default, CreatorDB shows the changes over 7 days, 30 days, and 90 days.
6 Total followers The number of followers changes over 90 days.

monthly_gain_in_followers

No. Metric Definition
1 Last updated The last date the system updated the monthly gain in followers data.
2 Monthly gain in total followers Shows the gain in total followers for that month.
3 Followers The change in number of followers gained per month.
4 Creator added in The date the system added this creator to the CreatorDB database.
5 Months  The months over one year.

Upload time (heat map)

The upload heat map indicates when a creator published the most recent 20 posts or videos. The heat map shows four periods throughout the day through the week that the creator uploads content and shows how frequently creators upload content. Note that the times are in the creator's local time zone.

view_creator_profile_all_platform_heat_map

Time period Time range
Night 0:00-6:00
Morning 6:01-12:00
Afternoon 12:01-18:00
Evening 18:01-24:00

Content breakdown

The content breakdown shows the most recent 20 posts by social media platform over 3 months. You can view the content breakdown by the content types or by platform.

view_creator_profile_all_platform_content_types

Platform types Content types
YouTube YouTube videos, YouTube shorts
Instagram Instagram posts, Instagram reels
TikTok TikTok posts

Account quality

The account quality dashboard presents an overview of the global performance of the creator's social media accounts. The indicators used to measure platform performance are based on the creator's average performance compared to similar channels.

view_creator_profile_all_platform_account_quality

Brand dashboard

Shows the latest four brands that sponsored a channel. Detailed information includes the sponsored content publish date and the number of sponsored content. The dashboard can display up to 60 sponsors' information.

view_creator_profile_all_platform_brand

Audience

This page will show the creator's YouTube channel audience demographics, which are updated every 100 days. For details, see YouTube audience.

Related

This page lists similar creator accounts in CreatorDB's database. The related accounts feature can help you find creators in the same field for collaboration purposes or competitor analysis.

Content

Shows the latest content that the creator has posted on various platforms, content analytics, trending content tags, and content categories. It considers the videos' historical average performance on multiple platforms, such as YouTube, Instagram, and TikTok.

When you click on a recent video, it will show an overview of the video's performance on its respective platforms. For details, see the following articles:

Content analytics

The content analytics metrics measure the content performance and posting frequency over 12 months. Each bar on the graph represents a month.

Group_102

No. Label Definition
1 Content per week The total number of content posted weekly by the creator.
2 Content per month The total number of content posted monthly by the creator.
3 Output consistency grade This metric measures the overall content generation performance by the creator's posting frequency.


Content tags

The most common hashtags in the creator's uploaded content are displayed. There are six different font sizes to indicate the hashtag's usage frequency. The larger the hashtag font, the higher the usage frequency. The platform can show up to 32 hashtags.

Screenshot_2024-12-16_at_10.21.54_AM

Top 5 topics from all platforms

The top 5 topics out of 470 associated with the creator’s content are displayed. These topics are based on YouTube classifications.

Top 10 niches from all platforms

The top 10 niches of the content are displayed. Niches are subcategories of topics. Currently, CreatorDB supports up to 16,000 niches that are applied to classify creators.

Screenshot_2024-12-16_at_10.25.30_AM

Brand

This page displays video content sponsored by brands on the creator’s social media platforms and provides information about brands sponsoring content.

Screenshot_2024-12-16_at_10.32.16_AM

Screenshot_2024-12-16_at_10.32.38_AM

YouTube

YouTube overview

youtube_subscribers_labeled

No. Label Definition
1 Main platform Indicates the creator's primary social media platform.
2 Subscribers Total YouTube subscribers.
3 Active An indicator that shows the creator has been actively uploading content to their YouTube channel over the last 30 days.
4 Subscriber growth rate The subscriber growth rate over 30 days.
5 Percentile performance The YouTube channel's performance percentage compared to the median value of similar channels.
6 Latest content The last date the creator uploaded content to YouTube.

youtube_key_statistics_labeled

No. Label Definition
1 All Shows the average key metrics performance from YouTube videos and shorts combined.
2 Videos Shows the key metrics performance for YouTube videos.
3 Shorts Shows the performance of the key metrics for YouTube shorts.
4 Active subscribers Percentage of YouTube subscribers that are actively engaged over the past month. Active subscribers are calculated as: Average Video Views/Subscribers
5 Average views The average number of views videos have received over the past month.
6 Engagement rate The percentage of engagement rate.
7 Average likes/ Comments The average number of likes and comments the creator's YouTube videos received over the past month.


youtube_creator_overview_labeled

No. Label Definition
1 CreatorDB score The YouTube channel’s CreatorDB score. The unique score sums up the subscriber rankings, view rankings, engagement rankings, subscriber growth rates, video views growth rates, and the engagement growth rate and then finds the average. The calculations are in percentiles.
2 Rating The CreatorDB score rating description. The ratings are:
- Superb (91 to 100)
- Excellent (81 to 90)
- Great (66 to 80)
- Good (51 to 65)
- OK (26 to 50)
- Poor (0 to 25)
3 Subscriber rank by country The subscriber rankings of the creator’s YouTube channel by country.
4 Subscriber rank by language The subscriber rankings of the creator’s YouTube channel by language.
5 Global subscriber rank The global subscriber rankings of the creator’s YouTube channel.

You can also view line graphs showing average video views, subscribers, or engagement rate changes by weekly (7 days), monthly (30 days), or quarterly (90 days).

view_creator_profile_youtube_average_views

Channel analytics by average views for YouTube videos over a 7-day period. This graph shows a steady increase in viewership over time.

view_creator_profile_youtube_subscribers_trend

Channel analytics by changes in the number of YouTube subscribers over 7 days. This graph shows no changes in the number of subscribers during this period.

view_creator_profile_youtube_engagement_rate

Channel analytics by changes in engagement rate over 7 days. This graph shows a stable engagement rate of around 6.02%.

Additionally, you can view the growth rate changes for average views, subscribers, and engagement rate by weekly (7 days), monthly (30 days), or quarterly (90 days).

youtube_average_views_growth

Average views growth rate over 7 days. This graph shows the average views growth rate from May 25 to May 27, 2025, was stable and declined nearly 5% on May 28 before increasing to a 2% growth rate on May 29.

youtube_subscriber_growth_rate

Subscriber growth rate over 7 days. This graph shows that the subscriber growth remained stagnant at 0%.

youtube_engagement_rate_growth_rate

Engagement rate growth rate over 7 days. This graph shows no engagement rate growth rate from May 25 to May 27, 2025. Then, the engagement rate grew to 8% on May 28 before declining drastically to -4% the next day.

youtube_heat_map_labeled


No. Label Definition
1 Day The day the creator uploads content throughout the week.
2 Number of content The number of YouTube videos and shorts uploaded. The darker the shade, the more videos uploaded.
3 Time The time in the day that content is uploaded.

view_creator_profile_youtube_content_breakdown

Here's a breakdown of the latest 20 pieces of YouTube content uploaded within three months. In this example, the creator has only uploaded YouTube videos over the past three months.


youtube_subscriber_monthly_gain

No. Label Definition
1 Monthly gain in total subscribers The gain in total subscribers for that month.
2 Subscribers The number of subscribers growth or decline in thousands (1k = 1,000 and 1M = 1,000,000).
3 Months The time by months.

The channel quality dashboard presents the channel's ranking metrics for different options based on six key indicators: average video views, average view growth, subscribers, subscriber growth rate, engagement rate, and engagement growth rate. It compares these different metrics against the median value of channels with the same topics. You can view these ranking metrics by country, language, or topics on YouTube.

view_creator_profile_youtube_ranking_metrics_overview

This image summarizes the YouTube channel's ranking metrics for different options. The various metrics are based on the average for all ranking options.

view_creator_profile_youtube_ranking_metrics_by_country

This image shows the YouTube channel's ranking metric performance compared to other channels in the same country.

view_creator_profile_youtube_ranking_metrics_by_topic

This image shows the YouTube channel's ranking metric performance compared to other variety gaming channels. The various metrics are based on the average for all channels labeled with various gaming topics.

YouTube interquartile range

You can view the creator's account or channel's video performance's interquartile range on the respective YouTube, Instagram, and TikTok tabs. The interquartile range measures the spread of the middle half of the distribution. It contains the middle half of the dataset in the distribution of a quartile segment split into four equal parts from low to high. This indicator can give you an overview of the creator's content views, ranging from lowest, median, to highest number of views.

The interquartile range calculates the percentile points for the average of the most recent 20 YouTube videos to analyze the interquartile range.

youtube_interquartile_range_labeled

No. Label Definition
1 Minimum views The minimum number of YouTube video views on this creator's channel.
2 Median views The average number of views YouTube videos have received on the creator's channel.
3 Maximum views The maximum number of views YouTube videos have received on the creator’s channel.
4 25% quartile The number of views the bottom 25% of videos have received on this creator’s YouTube channel.
5 Interquartile range (IQR) The median number of views the middle-ranking videos have received on this creator's YouTube channel.
6 75% quartile The number of views the top 25% of videos have received on this creator's YouTube channel.

YouTube audience

The YouTube channel's audience demographics are displayed.

youtube_audience_demographic_overview

No. Label Description
1 Audience top region The primary region that the creator's audience is from.
2 Audience gender The prominent audience gender.
3 Audience age The primary age group of the creator’s YouTube channel. Shows the percentage of the audience from this age group.
4 Average age The audience's average age.
5 Audience regions The top five regions where the creator’s audience is from.
6 Country breakdown The countries where most of the audience is from are generated by CreatorDB's proprietary AI model.

youtube_audience_age_and_gender

No. Label Description
1 Male The proportion of male audience for this creator's channel.
2 Female The proportion of female audience for this creator's channel.
3 Proportion (%) The percentage of the audience by different age brackets for this creator’s channel.
4 Age range The audience age range for this creator’s channel.

YouTube content

You can view the most recent YouTube videos uploaded to the creator's channel on the content page. You can also scroll down the page to view the creator's historical YouTube video performance and content analytics.

youtube_content_details_labeled

No. Label Definition
1 Views Total number of views this YouTube video received. (Note that 1K represents 1,000 views.)
2 Likes The total number of likes this YouTube video received.
3 Engagement Rate The engagement rate of this YouTube video. This is calculated as follows: (Likes+Comments)/Views
4 Comments The total number of comments this YouTube video received.
5 Video Length The length of this YouTube video in minutes.
6 Followers The creator’s total number of YouTube subscribers.
7 1 Day Views The number of views this YouTube video received on the first day it was published.
8 7 Day Views The number of views the YouTube video received on the seventh day it was published.
9 30 Day Views The number of views the YouTube video received on the thirtieth day it was published.
10 Add to group Add this creator to an existing group.
11 Published date When the creator published the YouTube video.
12 Sponsored badge A label that indicates if a brand or company has sponsored this YouTube video.
13 Sponsors The sponsors of this YouTube video.
14 Content Quality The quality indicators of this YouTube video are displayed in percentages.
15 Performance Metrics The views performance of this YouTube video over time.
YouTube content quality

The different gauges on the content quality dashboard provide an overview of the performance of specific video metrics. The possible gauge rankings are in descending order: superb, excellent, great, good, OK, and poor. For details, see CreatorDB score metrics.

youtube_content_quality_labeled

No. Metric label Definition
1 Views gauge An indicator that shows this YouTube video's overall views performance and ranking.
2 Views score The YouTube video's views score out of 100. The higher the score, the better the performance.
3 Views performance percentage The YouTube video's average views performance compared to the median value of the creator's latest 20 YouTube posts in percentage.
4 Likes gauge An indicator that shows this YouTube video's overall likes performance and ranking.
5 Likes score The YouTube video's likes score out of 100. The higher the score, the better the performance.
6 Likes performance percentage The YouTube video's average likes performance compared to the median value of the creator's latest 20 YouTube posts in percentage.
7 Engagement rate gauge An indicator that shows this YouTube video's overall engagement rate performance and ranking. For details, see Platform statistics.
8 Engagement rate score The YouTube video's engagement rate score is out of 100. The higher the score, the better the performance.
9 Engagement rate performance percentage The YouTube video's engagement rate performance compared to the median value of the creator's latest 20 posts on YouTube.
YouTube performance metrics

Obtains data from this YouTube video's views within 90 days and plots at least 12 to 15 points on a line graph. The data is updated daily.

youtube_content_performance_metrics_labeled

No. Metric label Definition
1 Views The number of views this YouTube video received.
2 Date The dates over 90 days.
YouTube content history

On the content history page, you can view the creator's channel changes in average YouTube video views, average likes, average comments, average engagement rate, and average video length.

youtube_content_history_labeled

No. Label Description
1 Average views The average number of views this creator's YouTube videos receive.
2 Average likes The average number of likes this creator's YouTube videos receive.
3 Average comments The average number of comments this creator's YouTube videos receive.
4 Metrics drop-down menu View the creator's performance by average views, average likes, average comments, or average engagement rate over one year. The YouTube video engagement rate is (Likes+Comments)/Views.
5 Comments The number of comments this YouTube creator received.
6 Dates The dates in 5-day intervals over one year.
YouTube content analytics

youtube_content_analytics_labeled

No. Label Description
1 Category breakdown The percentage of YouTube content posted by this creator by categories.
2 Content per week The number of content this creator posts to their YouTube channel weekly.
3 Content per month The number of content this creator posts to their YouTube channel monthly.
4 Output consistency grade A metric that measures how frequently this creator posts content on YouTube. This feature is still under development and will be available later.
5 Average content The average number of content that this creator posts per month.
6 Content The number of published YouTube content.
7 Time The period by months over one year.

YouTube brand

This page shows recently sponsored YouTube videos on the creator’s channel. By scrolling to the bottom of the page, you can view the most recent sponsors of the creator’s YouTube channel.
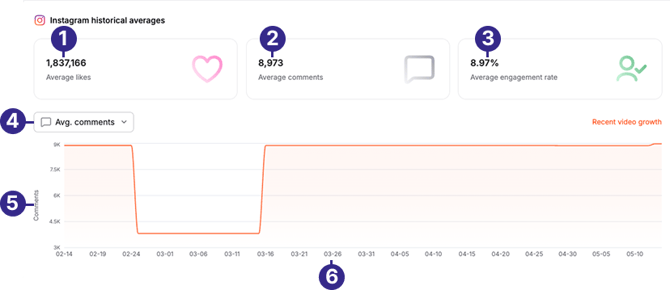
Screenshot_2024-12-18_at_11.44.00_AM

Instagram

Instagram overview

instagram_followers_labeled

No. Label Definition
1 Total number of followers The total number of Instagram followers the creator has. (k= 1,000, M= 1,000,000)
2 Active An indicator that shows the creator has been actively uploading content to their Instagram account over the last 30 days.
3 Follower growth rate The creator’s Instagram follower growth rate over 30 days.
4 Performance percentage The creator’s Instagram followers growth compared to the median value of similar channels.
5 Latest content The last date the creator uploaded content onto Instagram.

instagram_key_stats_labeled

No. Label Definition    
1 All Shows the performance of the key metrics for combined Instagram posts and reels.    
2 Posts Shows the key metrics performance for Instagram posts.    
3 Reels Shows the performance of the key metrics for Instagram reels.    
4 Total posts The creator's total number of Instagram posts.    
5 Recent posts & reels The latest posts and reels the creator has uploaded to Instagram.    
6 Engagement rate Measures how followers interact with the creator’s content on Instagram. The engagement rate on Instagram is: (Likes+Comments)/Followers    
7 Avg. likes The average number of likes the creator’s Instagram posts receive. (Unit is measured in 1,000. k = 1,000)    
8 Avg. comments The average number of comments the creator's Instagram posts receive.    

instagram_creator_overview_labeled

No. Label Definition
1 CreatorDB score The Instagram account's CreatorDB score. The unique score sums up the followers' rankings, view rankings, engagement rankings, followers' growth rates, post views growth rates, and the engagement growth rate, and then the average is calculated. The calculations are in percentiles.
2 Account rating The CreatorDB score rating description. The ratings are superb (91 to 100), excellent (81 to 90), great (66 to 80), good (51 to 65), OK (26 to 50), and poor (0 to 25)
3 Follower rank by country The follower rankings of the creator’s Instagram account by country.
4 Follower rank by language The follower rankings of the creator’s Instagram account by language.
5 Global follower rank The global follower rankings of the creator’s Instagram account.

You can also view line graphs that show changes in average likes per post, changes in followers, or engagement rate. You can view the changes weekly (7 days), monthly (30 days), or quarterly (90 days).

view_creator_profile_instagram_likes_growth

The average number of likes this Instagram account has received over the past 7 days. For this creator, their Instagram account's average likes remained unchanged from May 8 to May 12 before peaking on May 13.

view_creator_profile_instagram_followers_growth

This Instagram account's follower growth changes over the past 7 days. For this creator, their Instagram followers reached 20.8 million and have been stable till May 12 when it dropped sharply.

view_creator_profile_instagram_engagement_rate

This Instagram account's engagement rate changes over the past 7 days. For this creator, their engagement rate was steady at 8.71% from May 8 to May 12 before increasing to 8.97% on May 13.

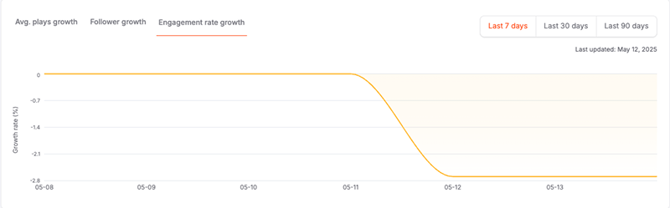
You can also view the changes in growth rates for average likes, followers, and engagement rates.

view_creator_profile_instagram_avg_likes_growth_rate

This Instagram account's average likes growth rate changes over the past 7 days. This creator's Instagram average likes growth spiked on May 13 to 3%.

view_creator_profile_instagram_follower_growth_rate

This Instagram account's follower growth rate changes over the past 7 days. This creator's Instagram follower growth rate remained unchanged from May 8 to May 12 and then declined by 0.12% on May 13.

view_creator_profile_instagram_engagement_rate_growth

This Instagram account's engagement growth rate changes over the past 7 days. This creator's Instagram's engagement growth rate remained unchanged from May 8 to May 12 before increasing to around 8.97% on May 13.

instagram_upload_time_labeled

No. Label Definition
1 Day The days throughout the week.
2 Uploads The number of Instagram content uploaded on this day and time.
3 Time The times this creator published Instagram content throughout the day.

instagram_content_breakdown_labeled

No. Label Definition
1 Instagram reels The percentage of Instagram reels uploaded to the creator’s account over 3 months.
2 Instagram posts The percentage of Instagram posts uploaded to the creator’s account of the most recent 20 posts within three months.

instagram_followers_monthly_gain

No. Label Definition
1 Followers growth per month The number of followers gained for this Instagram account for that month.
2 Followers The number of followers.
3 Period The months in a year.

The account quality dashboard presents the account's ranking metrics for different options by six key indicators: average likes, average likes growth, followers, followers growth rate, engagement rate, and engagement growth rate. The channel quality compares these different metrics against the median value of all Instagram accounts. You can view these ranking metrics by country, language, or view overall performance.


view_creator_profile_instagram_ranking_metrics_by_options

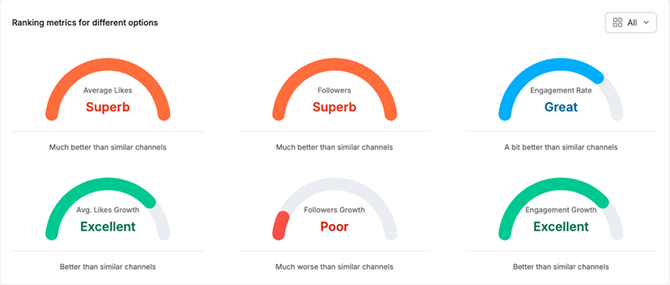
This image summarizes the Instagram account’s ranking metrics for different options. The various metrics are based on the average for all ranking options.

view_creator_profile_instagram_ranking_metrics_by_country

This image shows the Instagram account’s ranking metric performance compared to other accounts in the same country.

view_creator_profile_instagram_ranking_metrics_by_language

This image shows the Instagram account’s ranking metric performance compared to other accounts that use the same language.

Interquartile range

instagram_interquartile_range_labeled

No. Label Definition
1 Minimum likes The minimum number of likes this creator’s Instagram account has received.
2 Median likes The average number of likes this creator’s Instagram account has received.
3 Maximum likes The maximum number of likes this creator’s Instagram account has received.
4 25% quartile The number of likes the bottom 25% of posts have received on this creator’s Instagram account.
5 Interquartile range (IQR) The median number of likes the middle-ranking Instagram posts have received on the creator’s account.
6 75% quartile The number of likes the top 25% of posts have received on this creator's Instagram account.

Related accounts

Shows the 20 most relevant Instagram accounts with a similar audience.

view_creator_profile_instagram_related_accounts

Instagram content

This page displays the latest content uploaded to Instagram and content analytics, such as average likes, comments, and engagement rates.

instagram_content_details_labeled

No. Label Definition
1 View profile The creator's Instagram profile page.
2 Likes The total likes an Instagram post receives.
3 Comments The total comments the Instagram post received.
4 Engagement The Instagram post's engagement rate is calculated as follows: (Likes+Comments)/Followers
5 Avg. Engagement The average engagement rate for the last 20 Instagram posts.
6 Video Length The length of this Instagram post or reel in minutes.
7 Followers The creator's number of followers on Instagram.
8 1 Day Likes The total number of likes this Instagram post received when the creator posted it.
9 7 Day Likes The total number of likes this Instagram post received 7 days after the creator posted it.
10 30 Day Likes The total number of likes the Instagram post received 30 days after the creator posted it.
11 Add to group Add this Instagram creator to a group.
12 Publish date The date this post was published on Instagram.
13 Content Quality  This Instagram post's quality is based on likes and engagement rates.
14 Performance Metrics This Instagram post's performance based on the number of likes received over 30 days.
Content Quality

instagram_content_quality_labeled

No. Metric Label Definition
1 Likes rating A gauge that shows this Instagram post's likes performance and descriptive rating.
2 Likes score This Instagram post's likes score out of 100.
3 Comparison to median likes This shows Instagram's post likes performance in percentage compared to the median number of likes recent posts received.
4 Engagement rating A gauge that shows this Instagram post's engagement rate performance and descriptive rating.
5 Engagement rate score This Instagram post's engagement rate is out of a total score of 100.
6 Comparison to median engagement rate This shows Instagram's post engagement rate performance in percentage compared to the median engagement rate of recent posts.
Performance metrics

The total number of likes the Instagram post received over 90 days. This data is updated regularly depending on the creator's size and sponsorship activities.

instagram_content_performance_metrics

No. Label Description
1 Likes The number of likes the creator’s Instagram posts received.
2 Date The dates over 30 days.
instagram_historical_averages_labeled
No. Label Definition
1 Average likes The average number of likes this creator's Instagram posts received.
2

Average comments

The average number of comments this creator's Instagram posts received.
3 Average engagement rate The average engagement rate of this creator's Instagram posts. The Instagram post engagement rate is calculated as follows: (Likes + Comments)/ Followers
4 Metrics drop-down menu View the creator's Instagram post performance by average likes, average comments, or average engagement rate.
5 Comments The number of comments this Instagram creator received.
6 Dates The dates in 5-day intervals over one year.


instagram_content_analytics_labeled

No. Label Description
1 Category breakdown  A verified Instagram business account’s category.
2 Content per week The number of Instagram posts published by this creator weekly.
3 Content per month  The number of Instagram posts this creator published monthly.
4 Output consistency grade An indicator measuring how frequently this creator posts content on Instagram.
5 Average pieces of content The average number of Instagram content posted by this creator over one year.
6 Content The number of Instagram posts and reels posted by this creator.
7 Date The months over one year.

TikTok

TikTok overview

tiktok_followers_labeled

No. Label Definition
1 Total number of followers The total number of TikTok followers this creator has by the thousands. (k= 1,000, M= 1,000,000)
2 Active An indicator that shows the creator has been actively uploading content to their TikTok account over the last 30 days.
3 Follower growth rate This creator’s TikTok follower growth rate over 30 days.
4 Performance percentage This creator’s TikTok followers growth compared to the median value of similar TikTok accounts.
5 Latest content The last date the creator uploaded content onto TikTok.

tiktok_key_statistics_labeled

No. Label Definition
1 Average plays The average number of plays this creator’s TikTok posts receive.
2 Average hearts The average number of hearts the creator’s TikTok posts receive.
3 Average comments The average number of hearts this creator’s TikTok posts receive.
4 Engagement rate The engagement rate of the creator's TikTok posts is calculated by (Hearts+Comments+Shares)/Plays(Hearts+Comments+Shares)/Plays.

tiktok_creator_overview_labeled

No. Label Definition
1 TikTok platform score The creator’s percentile ranking on TikTok. This unique value is calculated using the following metrics: Number of followers, followers growth, engagement rate, engagement growth rate, average plate, and average growth rate.
2 Account rating The CreatorDB score rating description. The ratings are superb (91 to 100), excellent (81 to 90), great (66 to 80), good (51 to 65), OK (26 to 50), and poor (0 to 25)
3 Follower rank by country The follower rankings of the creator’s TikTok account by country.
4 Follower rank by language The follower rankings of the creator’s TikTok account by language.
5 Global follower rank The global follower rankings of the creator’s TikTok account.

You can also view line graphs showing average video plays, followers, or engagement rate changes by weekly (7 days), monthly (30 days), or quarterly (90 days).

tiktok_average_plays_labeled

No. Label Definition
1 Average plays The average number of plays the creator's TikTok videos received.
2 Followers The number of followers the TikTok creator has.
3 Engagement rate The average engagement rate of the TikTok creator's account.
4 Last updated The last time the TikTok creator's data was updated.
5 Last 7 days Shows the creator's TikTok metric performance for the last 7 days.
6 Last 30 days Shows the creator's TikTok metric performance for the last 30 days.
7 Last 90 days Shows the creator's TikTok metric performance for the last 90 days.
8 Average plays Shows the average number of plays each TikTok post received.
9 Date The date in 5-day intervals.

You can also view line graphs showing average plays growth, followers growth, or engagement rate growth by weekly (7 days), monthly (30 days), or quarterly (90 days).

view_creator_profile_tiktok_avg_plays_growth 1

This graph shows there was no growth in this TikTok creator's video average plays from May 6 to May 11  and then it suddenly declined by 28% on May 12.

view_creator_profile_tiktok_follower_growth_rate 1

This graph shows that a TikTok creator had no follower growth from May 8 to May 11, and then follower growth increased by 0.26% on May 12.
view_creator_profile_tiktok_engagement_rate_growth 1

This graph shows that a TikTok creator account had no change in engagement rate growth from May 8 to May 11, and then the engagement rate declined by 2.8% on May 12.

Upload time (heat map)

tiktok_upload_time_labeled

No. Label Definition
1 Day The days throughout the week.
2 Uploads The number of TikTok content uploaded on this day and time.
3 Time The times this creator published TikTok content throughout the day.

tiktok_followers_monthly_gainThe monthly gain in total followers shows an increase or decrease in TikTok followers. For this creator, their TikTok followers grew most in December 2024 with the addition of 202,100 followers.

No. Label Definition
1 Followers growth per month
The number of followers gained for this TikTok account for that month.
2 Followers The number of followers growth or decline in thousands (1k = 1,000 and 1M = 1,000,000).
3 Period
The months in a year.

The TikTok account quality dashboard presents the account's ranking metrics for different options based on six key indicators: average plays, followers, engagement rate, average plays growth, followers growth, and engagement growth rate. It compares these different metrics against the median value of TikTok accounts with the same topics. You can view these ranking metrics by all topics, language, or country on TikTok.

view_creator_profile_tiktok_ranking_metrics_by_topics 1This image summarizes the TikTok's account ranking metrics for all topics. The various metrics are based on the average for all topics.

view_creator_profile_tiktok_ranking_metrics_by_language 1This image shows the TikTok account's ranking metric performance compared to other accounts using the same languages.

view_creator_profile_tiktok_ranking_metrics_by_country 1This image shows the TikTok account's ranking metric performance compared to other accounts in the same country.

tiktok_interquartile_range_labeled

No. Label Definition
1 Minimum plays The minimum number of plays this creator’s TikTok videos have received.
2 Median plays The average number of plays this creator’s TikTok videos have received.
3 Maximum plays The maximum number of plays this creator’s TikTok video has received.
4 25% quartile The number of plays the bottom 25% of videos have received on this creator’s TikTok account.
5 Interquartile range (IQR) The median number of plays the middle-ranking videos have received on this creator’s TikTok account.
6 75% quartile The number of plays the top 25% of videos have received on this creator’s TikTok account.

TikTok content

You can view changes in TikTok's historical average plays (views), average hearts, average comments, and average engagement rate. You can also view the creator's content analytics to understand content production consistency better.

tiktok_content_details_labeled

No. Label Definition
1 Plays The number of plays this TikTok video received.
2 Hearts The number of hearts this TikTok video received.
3 Engagement The engagement rate of this TikTok video. For TikTok videos, the engagement rate is: (Hearts+Comments+Shares)/Plays
4 Comments The number of comments this TikTok video received.
5 Video length The length of this TikTok video.
6 Followers The total followers this creator's TikTok account has.
7 1 Day Plays This TikTok video's total number of plays received when the creator posted it.
8 7 Day Plays This TikTok video's total number of plays received 7 days after the creator posted it.
9 30 Day Plays This TikTok video's total number of plays received 30 days after the creator posted it.
10 Add to group Add this TikTok creator to a group.
11 Content quality This TikTok video's quality is based on respectively the number of plays and hearts it received and it's engagement rate.
12 Performance metrics The performance of this TikTok video is based on the number of plays it received over 30 days.
TikTok content quality

tiktok_content_quality_labeled

No. Label Definition
1 Plays rating A gauge that shows this TikTok video's plays performance and descriptive rating.
2 Plays score This TikTok video's plays score out of 100 points.
3 Comparison to median plays This shows TikTok video's play performance in percentage compared to the median number of plays this creator's last 20 TikTok videos received.
4 Hearts rating A gauge that shows this TikTok video's heart performance and descriptive rating.
5 Hearts score This TikTok video's hearts score out of a total of 100 points.
6 Comparison to median hearts This shows TikTok video's hearts performance in percentage compared to median number of hearts this creator's last 20 TikTok videos received.
7 Engagement rating A gauge that shows this TikTok video's engagement rate performance and descriptive rating.
8 Engagement rate score This TikTok video's engagement rate score out of 100 points.
9 Comparison to median engagement rate
This shows the TikTok video's engagement rate performance in percentage compared to the median engagement rate of this creator's last 20 TikTok videos.

TikTok performance metrics

tiktok_performance_metrics_labeledThe number of plays the TikTok video received over 90 days. Up to 15 data points are plotted as a line graph, and the data is updated daily.

No. Label Definition
1 Plays The number of plays this TikTok video received.
2 Date The dates over 90 days.

tiktok_content_history_labeled

No. Label Definition
1 Average plays The average number of plays this creator's TikTok videos have received.
2 Average hearts The average number of hearts this creator's TikTok videos have received.
3 Average engagement rate The average engagement rate of this creator's TikTok videos.
4 Drop-down menu A drop-down menu allows you to view the TikTok content history by average comments, plays, hearts, and engagement rates.
5 Comments The number of comments this creator's TikTok videos received. The Y-axis of this line graph will display the relevant selected metric view, such as plays, hearts, and engagement rates.
6 Dates The dates over 90 days.
TikTok content analytics

tiktok_content_analytics_labeled

No. Label Definition
1 Content per week The number of TikTok videos this creator posted weekly.
2 Content per month The number of TikTok videos this creator posted monthly.
3 Output consistency grade An indicator measuring how frequently this creator posts content on TikTok.
4 Average pieces of content The average pieces of TikTok content this creator posted over one year.
5 Content The number of TikTok videos posted by this creator.
6 Time The months over one year.

Downloading creator profiles

You can download up to 1,500 creator profiles on the same page each time.

Note:

  • The system will download all creator profiles on the same page.
  • The system currently does not support downloading selected creators. To download only selected creators, add them to a group and download the group. For details, see Downloading creators in a group.
  • You can cancel the download anytime by clicking Cancel.
  1. Log in to CreatorDB.
  2. Search for creators. For details, seeSearching for creators.
  3. Click Download.
    Downloading all creator profiles on the same page may take a few minutes.
    download_creators_1_labeled
    download_creators_2_labeled